PcapGraph Manual
Create bar graphs with packet capture timestamps.
About
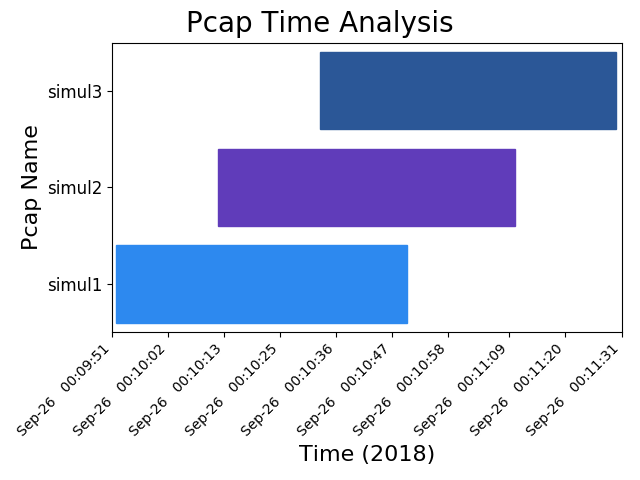
Three packet captures taken of the same network traffic, staggered by 20 seconds.
Platforms
Linux, macOS, Windows
Description
- Assists with flow-based troubleshooting where there are at least 3 pcaps. See Usage for detailed use cases.
- Create a horizontal bar graph to visualize when pcaps were taken.
- Use set operations to find patterns among multiple packet captures in ways that Wireshark is not able to.
- If an output format is not specified, the default behavior is to print to stdout and send a matplotlib graph to the screen (thus the name).